Detection of Unknown Signals
This example shows how to design a detector to detect an unknown signal embedded in ambient noise. Due to the generally unknown signal, the matched filter cannot be used for detection. In this case, the baseline detector is an energy detector. As the energy detector does not use any prior information, the energy detector can hardly detect the signal given a low false alarm rate. The goal of this example is to show how to improve the detection performance by using additional knowledge of the signal.
What Is an Unknown Signal Detection Problem?
Our obtained data is the noise-free signal embedded in complex white Gaussian noise with noise power :
For simplicity, we assume the noise power is known from additional noise data. The goal of the unknown signal detection problem is to solve the following hypothesis testing problem:
where is referred to as the null hypothesis and as the alternative hypothesis. This problem can be solved by comparing the ratio of likelihood functions under each hypothesis to a threshold. The result can be simplified to comparing detection statistics to a detection threshold . The detector decides is true (a signal is detected) if , and decides is true (no signal is detected) otherwise.
The performance of the detector heavily relies on the detection statistics , while the detection statistics depends on the model and knowledge of the signal. If the model of the signal is incorrect, the detection performance will be poor. If the model of the signal is close to the true signal, the detection performance heavily depends on the knowledge of the parameters in the signal model. Thus, in the following, we first introduce how to choose a signal model. Then, we mainly focus on how to design detectors according to the knowledge in the signal model.
How to Select a Signal Model?
In general, there are 3 steps to select a signal model. We illustrate the 3 steps using the following example.
Let's consider that the true unknown signal is a periodic signal composed of the fundamental and first 4 harmonics.
Step 1: Choose A General Signal Model Type.
The periodic signal can be represented as a Fourier series. The Fourier series model of is given as
where is the fundamental frequency of the periodic signal, is the time-domain sampling frequency, is the number of time-domain samples, is the complex amplitude of the -th signal component, and is the number of signal components (1 fundamental and the first harmonics).
Step 2: Choose The Model Order.
In this example, the model order is the number of signal components .
Step 3: Choose The Values of Parameters.
The values of parameters can be either known or unknown. In this example, the sampling frequency and the number of time-domain samples are known. The fundamental frequency , the complex amplitudes of the signal components are in general unknown.
Design Detectors According to Knowledge in Signal Model
We configure the periodic signal in the UnknownSignalDetectionSimulink_params function and configure , , , , and the signal to noise ratio (SNR) approximately to be 10 dB. The amplitudes of the signal components are selected to model signal attenuation in a channel where higher frequency components experience stronger attenuation.
In the following, we detect the existence of the periodic signal from the data using three detectors: energy detector, LRT detector, and GLRT detector. These detectors assume different knowledge of the signal model. An overview of the Simulink models is given below.
load_system('UnknownSignalDetectionSimulink');
open_system('UnknownSignalDetectionSimulink');

Baseline Detector: Energy Detector
For the energy detector, the true signal is assumed to be fully unknown. The detection statistics of the energy detector is
where is the signal power summed over time. Under hypothesis (when the signal is not present), the detection statistics follows the chi-squared distribution with degrees of freedom, i.e., . Thus, for a given probability of false alarm , the detection threshold of the energy detector is given by
where is the inverse cumulative distribution function (CDF) of the chi-squared distribution with degrees of freedom , evaluated at the probability values in .
In this example, the energy detector is implemented in the Energy Detector block. The inputs of the energy detector are the data and the known noise power . We configure the probability of false alarm . Run the simulation for 1 second to generate multiple independent data samples over time and use scope to display the detection result for each data sample. We can observe that the energy detector can only output very few detected results in the 1 second duration. The detection rate of the energy detector is also very low.

Ideal Detector: LRT Detector
To show the potential detection performance improvement, we use the LRT detector to show the performance upper bound for the detection problem.
The LRT detector assumes the perfect knowledge of the signal and applies the matched filter to detect the signal. The detection statistics of the LRT detector for complex data is
For a given probability of false alarm , the detection threshold of the LRT detector for complex data is given by
where is the inverse complementary error function evaluated at the value . For more information about the LRT detector, please refer to the documentation page of phased.LRTDetector.
In this example, the LRT Detector block is used for LRT detection. The inputs of the LRT detector are the data , the known signal and the known noise power . Run the simulation under the same configuration as the energy detector and use the scope to display the result. The LRT detection result and detection rate show that there is a great potential for detection performance improvement compared to the energy detector. However, it is hard to attain this performance upper bound in practice because we don't fully know the periodic signal .

Practical Detector: GLRT Detector
A more practical detector that can improve the detection performance is the GLRT detector. We design a GLRT detector as follows.
Signal Model Selection
We design the GLRT detector by first selecting a more detailed signal model following the 3 steps introduced in the last section.
We select the Fourier series model of described in the last section.
We choose the model order . That is, we assume the signal contains 1 fundamental and first 2 harmonics, which predicts less harmonics than the true signal but captures the most significant ones, because only the first few harmonics typically have significant amplitudes.
We choose the complex amplitudes of the 3 signal components as the unknown parameters. We select the fundamental frequency as a fixed constant initially and we will introduce how to select later.
In summary, the GLRT detector adopts the following linear deterministic signal model with unknowns in :
where with is the observation matrix at a specific fundamental frequency .
Design a GLRT Detector According to the Selected Signal Model
The GLRT detection problem is formulated as
Equivalently, for signal model the detection problem is
This is a well-known linear deterministic signal detection problem. The detection statistics of the GLRT detector for complex data is
For a given probability of false alarm , the detection threshold of the GLRT detector for complex data is given by
For more information about the GLRT detector, please refer to the documentation page of phased.GLRTDetector.
Optimize the Signal Model
Until now, we have designed a GLRT detector for a given fundamental frequency . However, the fundamental frequency is hard to known in practice. As one value of corresponds to one signal model, we can formulate multiple signal models with different and select the best signal model. According to the GLRT theory, finding the best signal model in this problem is equivalent to finding that maximizes the GLRT detection statistics , i.e., the optimal can be found via solving the following optimization problem:
Let's assume prior knowledge that the fundamental frequency is within 3MHz. We can configure observation matrix over multiple frequency bins with frequency ranging from 0 to 3MHz and select the optimal frequency bin that maximizes the GLRT detection statistics.
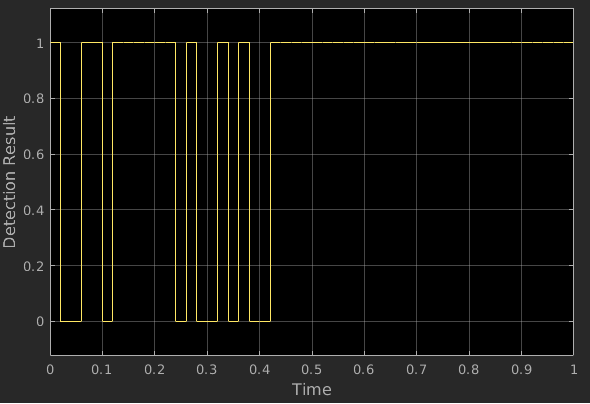
In this example, the GLRT Detector block is used for GLRT detection. The inputs of the GLRT detector are the data , the augmented hypothesis matrix , a set of observation matrices at different fundamental frequencies, and the known noise power . Run the simulation under the same configuration as the energy detector and the LRT detector. We use the scope to display the detection result over time and display the detection rate. The GLRT detection result shows that although the model order assumption in the GLRT model is inaccurate, the detection rate of the GLRT detector is much higher than that of the energy detector and is also close to the detection rate of the ideal LRT detector.
Summary
In this example, you learned what an unknown signal detection problem is, how to select a signal model, and how to design and optimize a detector according to the signal model.
Reference
[1] Steven M. Kay, Fundamentals of Statistical Signal Processing, Detection Theory, 1998
[2] Steven M. Kay, Fundamentals of Statistical Signal Processing, Practical Algorithm Development, 2013
You can also select a web site from the following list:
Americas
- América Latina (Español)
- Canada (English)
- United States (English)
Europe
- Belgium (English)
- Denmark (English)
- Deutschland (Deutsch)
- España (Español)
- Finland (English)
- France (Français)
- Ireland (English)
- Italia (Italiano)
- Luxembourg (English)
- Netherlands (English)
- Norway (English)
- Österreich (Deutsch)
- Portugal (English)
- Sweden (English)
- Switzerland
- United Kingdom (English)