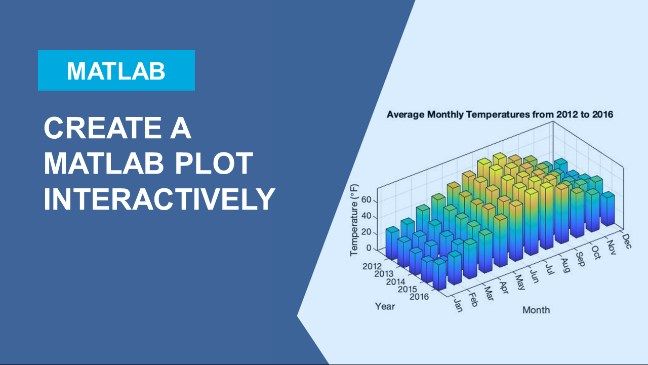
Learn how to create and interact with plots in MATLAB®, which is an important part of creating MATLAB code. Anyone – from beginners hoping to create their first plot to advanced users looking for a refresher – can use these plotting techniques and functions. This video covers making and plotting data, and it shows different plot screen positioning options and plot appearance options.
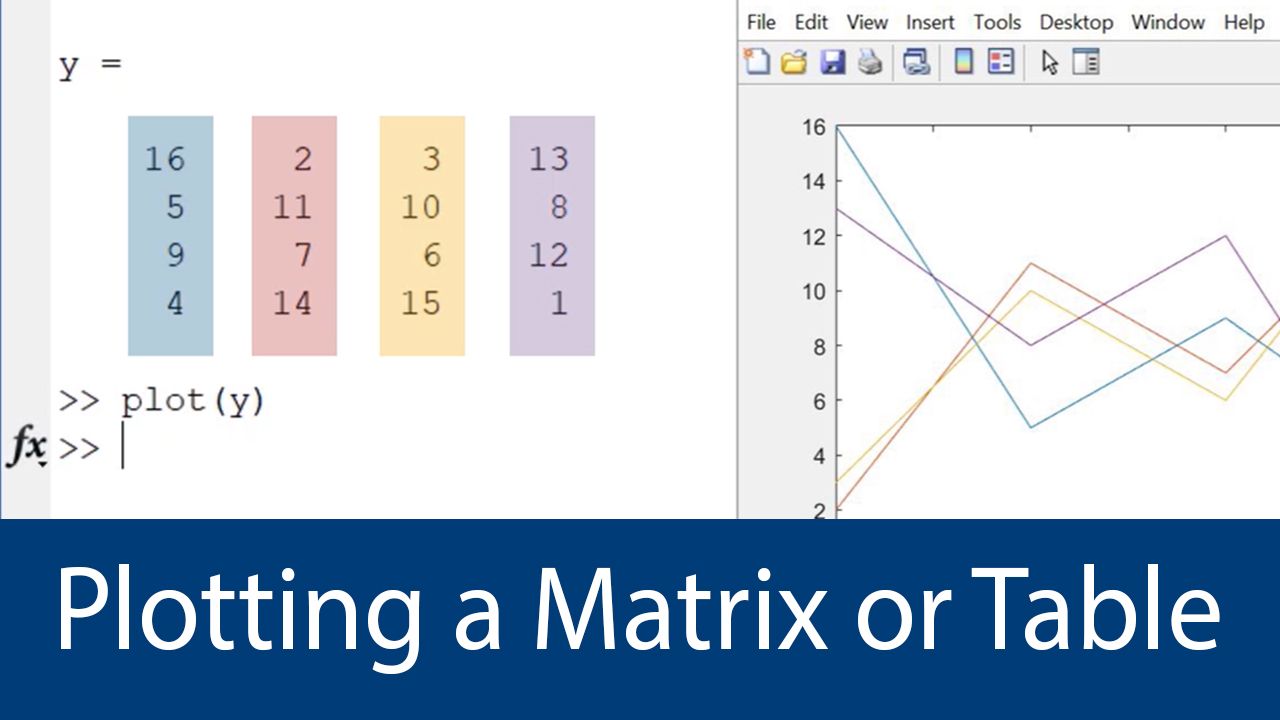
The video first walks through the process of creating sets of numbers that are ready to be inputted into a plot. It illustrates how you can quickly make sample data for a plot using commands like randn and linspace. Then, the video covers the plot function itself, and it shows how using the plot function instantly creates a plot figure window containing the data.
Next, you’ll learn about the options for moving and positioning your plot around the MATLAB environment. This includes the hold on/hold off commands, docking and undocking plots, and the axes toolbar, all of which allow you to manipulate your plot’s location.
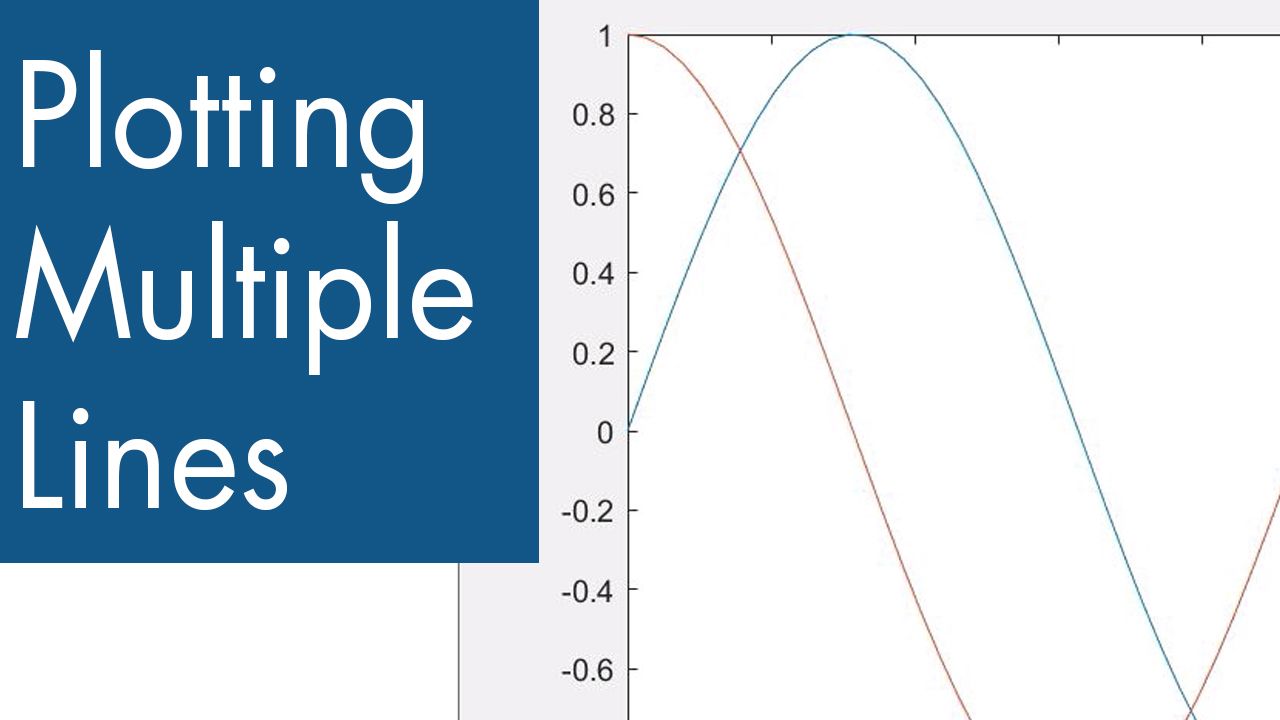
Finally, the video covers options for changing a plot’s appearance. This includes adding titles, axes labels, and legends, and editing a plot’s lines and markers in shape, style, and color.
For more information on plotting, you can use help and documentation right from within MATLAB.